
A new tool can measure emissions from public transport. It uses open data, making it easy to use across the world, and it’s free! João Pedro Bazzo Vieira, Rafael H. M. Pereira and Pedro R. Andrade present
Effective public transport is the backbone of mobility in large urban areas. But the same systems that make our cities livable can also create environmental challenges linked to CO2 emissions and poor air quality.
You cannot fix what you cannot measure
Governments play a critical role in helping accelerate the transition to less-polluting, low-carbon public transport. City authorities can use various tools like targeted public investment and optimal regulatory policies. But how can they assess when a policy is effective or not? Currently, we lack a method to measure the environmental benefits of transport policies and interventions. This is a particularly pointed issue in emerging economies where the lack of data is a common problem.
Introducing the gtfs2emis model; a novel method to easily estimate the emissions from public transport. The free tool uses an open data format already widely used by transport agencies worldwide. The General Transit Feed Specification (GTFS) format makes it easy to apply the tool in different contexts.
Friendly and reproducible
Our recent work shows how gtfs2emis is friendly to use and reproducible. It allows the efficient computation of over 16 pollutants at the vehicle level. Presented as an R package, it uses seamless parallel computing based on data from different emission factor models for Europe (European Environmental Agency), the United States (California Air Resource Board and Environmental Protection Agency), and Brazil (Environmental Company of São Paulo).
The package works as a two-step model. The first step is to convert the GTFS data input into a trajectory data table, similar to GPS records with the space-time position of every public transport vehicle. The second step is the emission model, which estimates the pollutants emitted by each vehicle at each road segment and time of the day by combining the output from the transport model with additional data on fleet characteristics provided by the user, together with emission factors provided in the package.
Spotlight on São Paulo
In our case study, we demonstrate an application of the gtfs2emis model to estimate the CO2 and PM10 (particles less than 10 µm in diameter) emissions of urban buses in São Paulo, Brazil, one of the largest cities in the Global South.
São Paulo runs a vast and complex public transport network. Over 1 300 routes and around 194 000 bus trips per day run on a fleet of over 14 000 buses. 98.6% of them run on diesel.
According to our estimates, the São Paulo buses emit approximately 3.34 Gt of CO2 and 344.8 kg of PM10 on a typical business day. The gtfs2emis model allows us to map the distribution of the emission levels at high spatial resolutions (Figures 1 and 2), showing the hotspots of higher emissions along specific transportation corridors and bus stations (Figure 1). These areas are often busy roads with a high frequency of public transport services, and their identification can help inform further research on air pollution exposure.
Figure 1: CO2 and PM10 emissions on a typical business day.
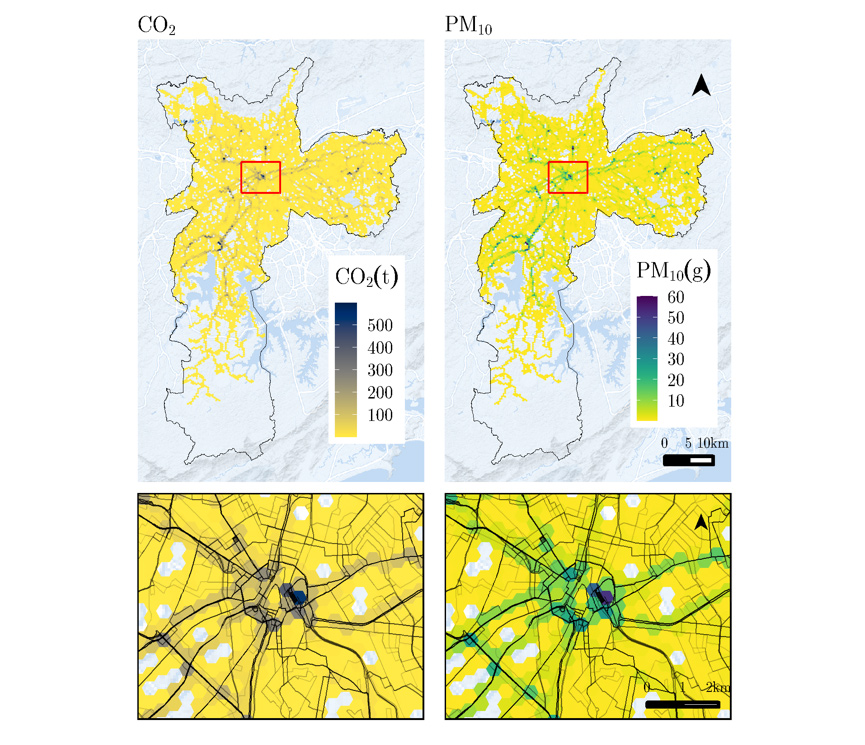
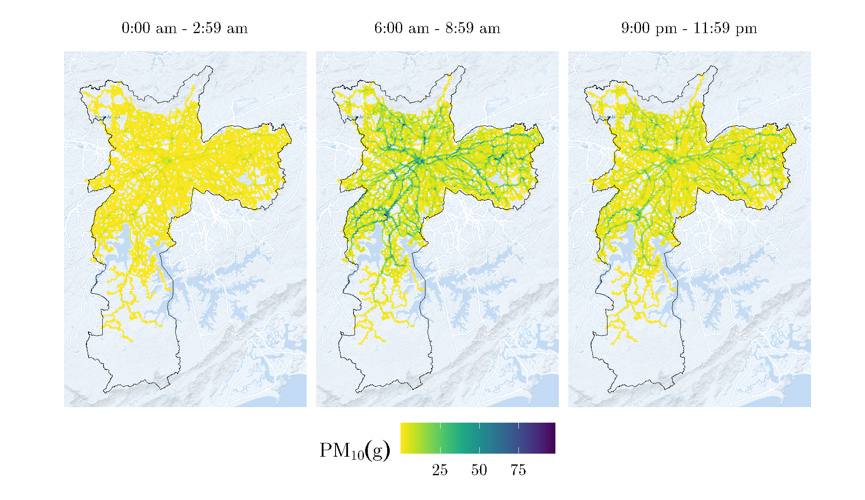
Figure 2: Spatial and temporal distribution of PM10 emissions.
Highlighting hotspots
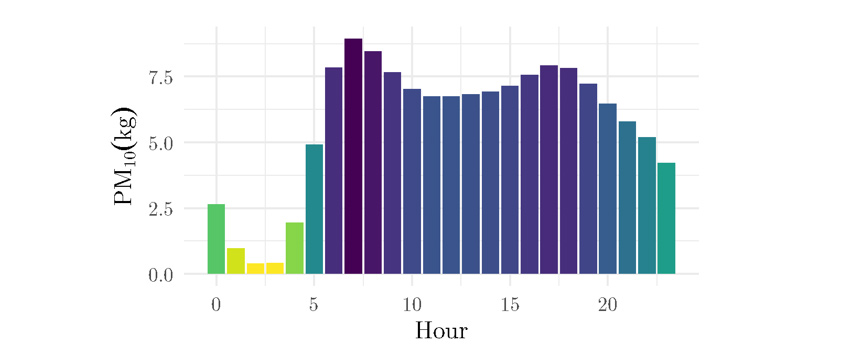
The model also allows us to determine how these pollution estimates are distributed across different times of the day (Figure 3). The morning and afternoon peak periods present substantially higher emission levels. This is largely due to how these periods generally have both higher service levels and lower speeds.
Figure 3: PM10 emissions aggregated temporally.
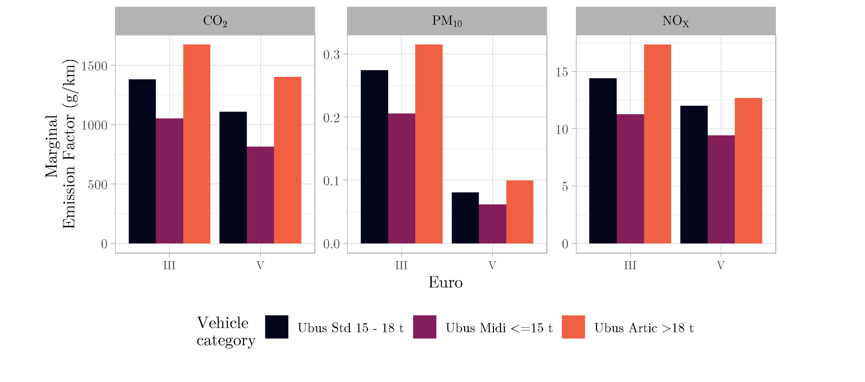
We can even examine the influence of fleet age on total emissions. The model allows us to show the marginal emission factors aggregated by EURO (exhaust emission standard) stage, vehicle category, and pollutant (Figure 4).
The Euro III vehicles, produced before 2012, strongly influence the overall PM10 and NOX emissions. If all buses with Euro III stage in the public transport system of São Paulo were to be replaced by new buses of the same category but with Euro V standard, the total emissions of PM10 and NOX would be cut by 32.6% and 4.4%, respectively.
Figure 4: Emission factors of CO2, PM10, and NOX.
The gtfs2emis model can help to develop policies for low-carbon transitions in different ways. For instance, transport agencies can simulate how much different policy scenarios with electrification policies or fleet renewal investments could reduce CO2 or PM10 emissions.
In addition, the model can monitor how proposed changes to public transport service levels or vehicle technologies could help cities to meet emission reduction targets. By combining information on passenger volume, the model can examine the environmental performance of public transport routes in terms of emissions per passenger per vehicle per kilometre travelled.
gtfs2emis can also help stakeholders determine which transport corridors have higher levels of emissions that should be prioritised for electrification or even which neighbourhoods and socio-economic groups are more exposed to pollution from public transport systems.
The gtfs2emis package is developed by João Bazzo and Rafael Pereira from the Institute for Applied Economic Research (IPEA) in collaboration with Pedro Andrade from the National Institute for Space Research (INPE), both from Brazil.
Rafael Pereira is the International Transport Forum’s Young Researcher of the Year Award Winner 2019. Rafael’s work on the gtfs2emis model also earned a finalist position for the 2022 Decarbonising Transport Award.
Learn more about ITF’s Decarbonising Transport initiative that promotes carbon-neutral mobility to help stop climate change. It provides decision makers with tools to select CO2 mitigation measures that deliver on their climate commitment.

Clean public transport is a must. Thank you 🌍🙏
LikeLike